



Advanced AI Observability
Full-stack observability from infrastructure to AI. Every signal in one place. Every cost tied to the workload that caused it.

Centralized Dashboard

Infrastructure to Application Correlation

Predictive Alerts and Incident Management

AI Observability Metrics
You can watch CPU and latency all day and still have no idea what your agents are doing, what they're costing you, or whether the output is any good. This layer adds that visibility using the metrics, logs, and traces you already collect.

Signal Fragmentation
Your metrics and traces live in separate tools, so when something slows down you're stuck flipping between tabs trying to line them up. Pull them together and a latency spike shows you whether it's the model or the GPU.

No Ownership Routing
An alert goes off and everyone assumes someone else is on it. Send each incident to the team that can fix it (platform, app, or the AI itself) so it doesn't die in a shared channel.

No Path to Excellence
Every incident gets handled from scratch because no one really owns observability. A Center of Excellence gives it an owner and a standard the whole org can work from.
Four teams. One source of truth.
Everyone who answers for AI in production gets a view built for their job; from a single model run to the monthly bill. Powered by Grafana, hosted in the Kingdom.
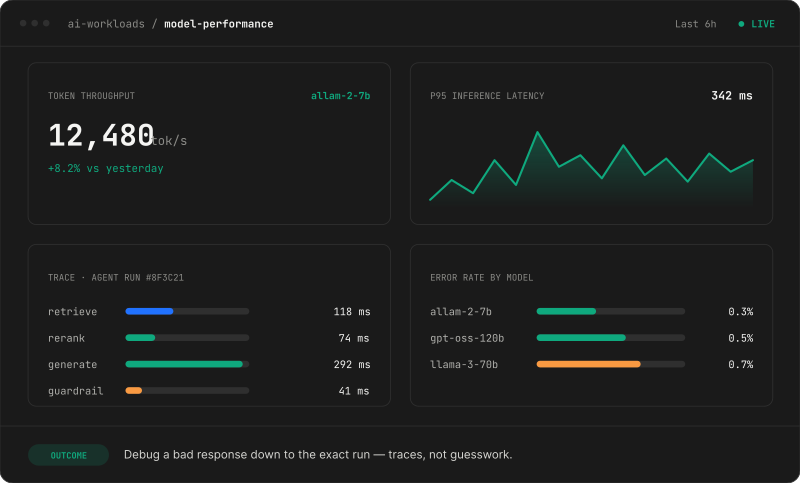
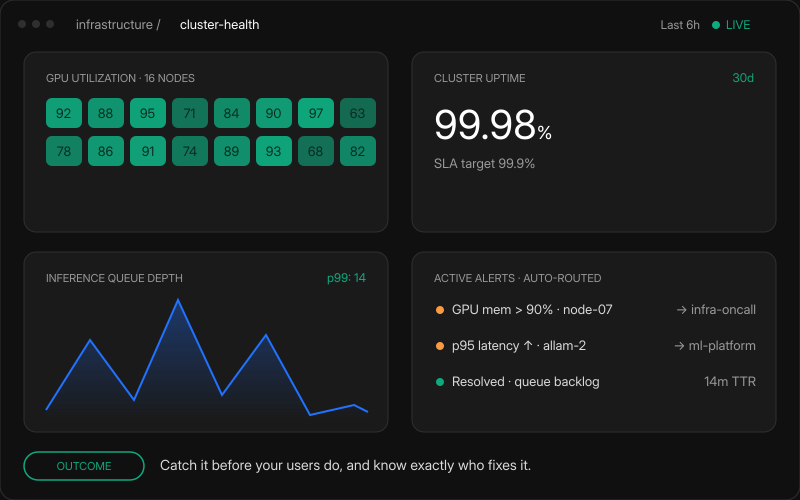
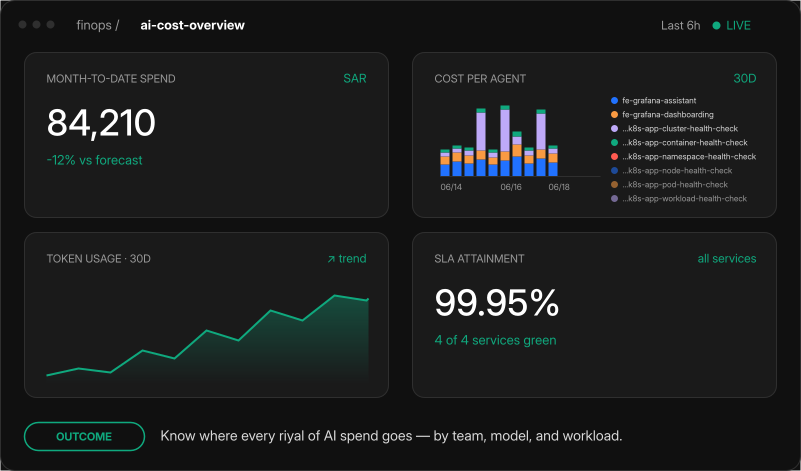
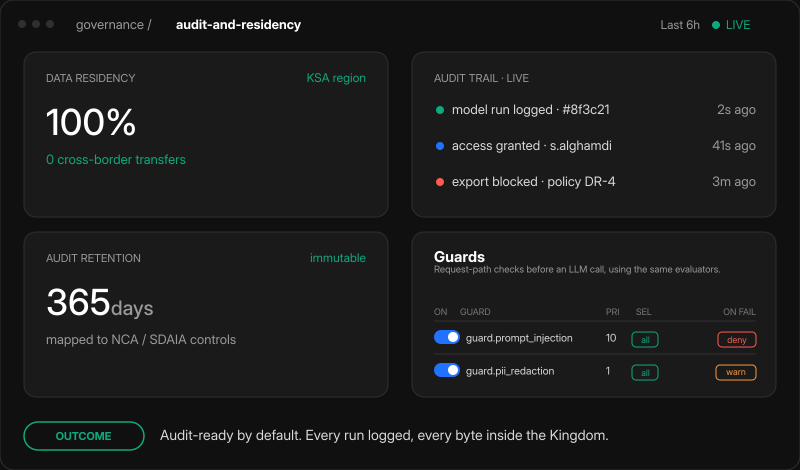
 Full-Stack Observability Infrastructure to AI

Stop Guessing. Start Seeing.
Tell us what you're running. We'll tell you what it takes.
Request Observability AssessmentFrequently Asked Questions
First dashboards and alerts typically land within weeks of instrumentation. Full implementation depends on scope and access cycles.
Yes. We instrument on-prem, cloud, hybrid, and air-gapped workloads.
Yes. LLM response times, token costs, GPU utilization, and VectorDB performance. For on-prem and air-gapped deployments, coverage includes model request visibility, token categorization, cost monitoring, and RAG performance. If you run Bunyan or Rekaz, the AI observability layer integrates directly
Managed service is available by contract. Coverage depends on scope and delivery model.
One incident example. Current dashboard access. Ownership contacts. We scope from there.